
How to increase customer response rates in campaigns

The four levers that move response rates fastest are audience selection, offer fit, follow-up cadence, and deliverability. Get those right and everything else is refinement. Campaign response optimisation research shows audience selection alone explains roughly 40% of response variance, with offer fit accounting for another 40% and creative the remaining 20%. That 40/40/20 rule is a useful sanity check before you spend a single hour on subject line copy.
Three things to test this week:
- Shrink your segment. Take your broadest active list and cut it to the top 20% by recency and engagement. Send to that cohort only and compare reply rates.
- Add a value-focused follow-up. If your sequence stops at one touch, add a second message three days later that leads with a new angle, not a “just checking in” nudge.
- Fix SPF, DKIM, and DMARC. If your domain lacks all three authentication records, inbox placement is compromised before a single word of copy is read. Check your status via Google Postmaster Tools in under ten minutes.
Quick benchmark bands to orient your performance: a cold email reply rate below a low single-digit percentage signals a list or deliverability problem; a mid-single-digit percentage is workable; high single-digit percentages and above is strong. Direct mail response rates typically fall within a low single-digit range for consumer campaigns. Paid search click-through rates vary widely by sector, but mid-single-digit percentages are a reasonable mid-market target. SMS open rates are generally high, but response rates depend heavily on offer quality and consent quality.
Key takeaways
Audience selection, deliverability, and structured follow-up sequences are the three highest-return levers to increase customer response rates across campaigns, and all three can be tested within a single four-to-six-week pilot.
| Point | Details |
|---|---|
| Audience selection drives ~40% of variance | Prioritise list hygiene, RFM segmentation, and suppression before any creative work. |
| Fix authentication before copy tests | SPF, DKIM, and DMARC must pass before subject line or body copy experiments produce reliable results. |
| Most replies come from follow-ups | A structured 4–6 touch B2B sequence, with each touch adding a new angle, generates the majority of replies. |
| Signal-based personalisation lifts reply rates | Teams using signal personalisation report 12–18% reply rates versus 3–5% for generic outreach. |
| Michaelbell runs data-first pilots | MB Brand Communications audits data, authentication, and sequence structure before creative, delivering measurable uplift in four to six weeks. |
Table of Contents
- How do you calculate campaign response rates correctly?
- What do good response rates look like by channel in the UK?
- High-impact email tactics that reliably raise reply rates
- Direct mail levers: formats, list quality and digital integration
- Paid search, paid social and SMS tactics to boost response
- Fix your data first: hygiene, segmentation and UK compliance
- How to design experiments that prove real uplift
- Multi-touch follow-up sequences for B2B and B2C
- How MB Brand Communications approaches lifting response rates
- MB Brand Communications: the agency that works like your team
- Sources
How do you calculate campaign response rates correctly?
The formula is straightforward: Response Rate = (Unique Human Replies ÷ Delivered) × 100.
The denominator matters. Use delivered (sent minus hard bounces), not raw sent, because including undeliverable addresses inflates your denominator and flatters your rate. Exclude automated out-of-office replies, auto-acknowledgements, and bounce notifications from the numerator. You want genuine human intent, not inbox noise.
Four metrics worth tracking on every campaign:
- Reply rate — unique human replies divided by delivered. Your primary signal for cold email and direct response.
- Positive reply rate — replies that express interest or ask a question, divided by delivered. A cleaner measure of real pipeline signal.
- Meeting booked rate — booked calls or demos divided by delivered. The conversion metric that ties directly to revenue.
- Campaign response rate (omnichannel) — total responses across all channels (clicks, calls, form fills, replies) divided by total addressable contacts reached.
Worked example. You send 1,200 emails. 80 hard-bounce. Delivered = 1,120. You receive 47 replies; 9 are out-of-office. Unique human replies = 38. Of those 38, 14 express genuine interest. Five meetings are booked.
| Metric | Formula | Reporting cadence |
|---|---|---|
| Reply rate | Unique human replies ÷ delivered | Per campaign send |
| Positive reply rate | Interested replies ÷ delivered | Per campaign send |
| Meeting booked rate | Booked meetings ÷ delivered | Weekly |
| Campaign response rate | All responses ÷ total reached | Per campaign |
| Unsubscribe / opt-out rate | Opt-outs ÷ delivered | Per send (flag if >1–2%) |
What do good response rates look like by channel in the UK?
Setting realistic expectations by channel prevents misreading a perfectly healthy result as a failure, or missing a genuine problem because a metric looks “normal.”
| Channel | Primary success metric | Typical range (UK) | Strong performance |
|---|---|---|---|
| Cold email | Reply rate | 2–5% | 8%+ |
| Warm/nurture email | Open rate + click rate | Open mid-single-digit percentages CTR mid-single-digit percentages | Open high single-digit percentages, CTR similar |
| Direct mail (consumer) | Response rate | 2–5% | 7%+ |
| Paid search | Click-through rate | 3–6% | 8%+ |
| Paid social | Click-through rate | 1–2% | 2%+ |
| SMS | Response/redemption rate | 5–15% | 20%+ |
| Survey (CX) | Completion rate | 10–30% | 40% |
The primary lever differs by channel. For cold email, list quality and deliverability drive the floor; copy and personalisation drive the ceiling. For paid social, audience exclusion lists and creative freshness matter most. For direct mail, leveraging first-party customer data to sharpen the list typically outperforms any creative upgrade. For SMS, consent quality and offer clarity are non-negotiable.
High-impact email tactics that reliably raise reply rates
Start with infrastructure, not copy
Deliverability and authentication are the foundation. Before testing subject lines, confirm:
- SPF, DKIM, and DMARC records are published and passing.
- New sending domains are warmed over 4–8 weeks before full-volume sends.
- Bounce rates stay below 1–2% per send.
- Spam complaint rates are monitored via Google Postmaster Tools.
- One-click unsubscribe is enabled (required under UK and EU rules).
Teams that skip this step and jump straight to copy tests see smaller, inconsistent gains. Fix the infrastructure first.
Copy mechanics that move the needle
Short emails outperform long ones. The highest reply rates in large-dataset analyses cluster in the 50–80 word band. One message, one ask. Subject lines of 6–10 words tend to perform well; avoid spam-trigger words and excessive punctuation. For cold outreach, disable open tracking pixels — they add code that some filters flag, and open rate is a vanity metric for cold email anyway.
Signal-based personalisation
Demographic personalisation (“Hi [First Name], I see you work in marketing”) barely moves reply rates. Signal-based personalisation does. A signal is a recent, observable event: a new hire announcement, a funding round, a job posting, a published article, a product launch. Reference it in your opening line and the email reads as genuinely relevant. Teams using signal personalisation report materially higher reply rates compared to generic outreach, indicating the effectiveness of timely, relevant messaging. The window is short; act within 24–48 hours of detecting the signal.
Sequence design and timing
Most replies come from follow-ups, not the initial send. A 4–6 touch B2B sequence is the standard starting point. Space touches 3–5 days apart initially, extending to 7 days for later touches. Each message must add a new angle: social proof, a case study, a direct question, or a final “closing the loop” note. Never repeat the same ask twice.
Deliverability checklist before any send:
- SPF record published and passing
- DKIM signing active on sending domain
- DMARC policy set (at minimum p=none with reporting)
- Domain warm-up complete
- List verified (no role addresses, no catch-alls)
- One-click unsubscribe active
A/B test ideas to run now:
- Subject line: question vs. statement
- Email length: 50 words vs. 100 words
- Signal personalisation vs. generic opener
- Single CTA vs. no CTA (reply-only)
- Send time: Tuesday 8AM vs. Thursday 10AM
Pro Tip: Short personalised videos embedded in outreach can double or triple engagement compared with plain text. A 30-second screen recording that references the prospect’s specific situation creates a visual, non-templated signal that inbox filters treat differently from standard HTML. Tools like Sendspark make this scalable without requiring a production team.
Direct mail levers: formats, list quality and digital integration
Formats worth the investment
Dimensional pieces (boxes, tubes, tactile inserts) consistently outperform flat mail in response rate because they cannot be ignored on a desk. Polywraps work well for high-volume consumer campaigns where cost-per-piece matters. Personalised URLs (PURLs) on printed pieces create a trackable bridge between physical and digital, letting you measure incremental lift cleanly.
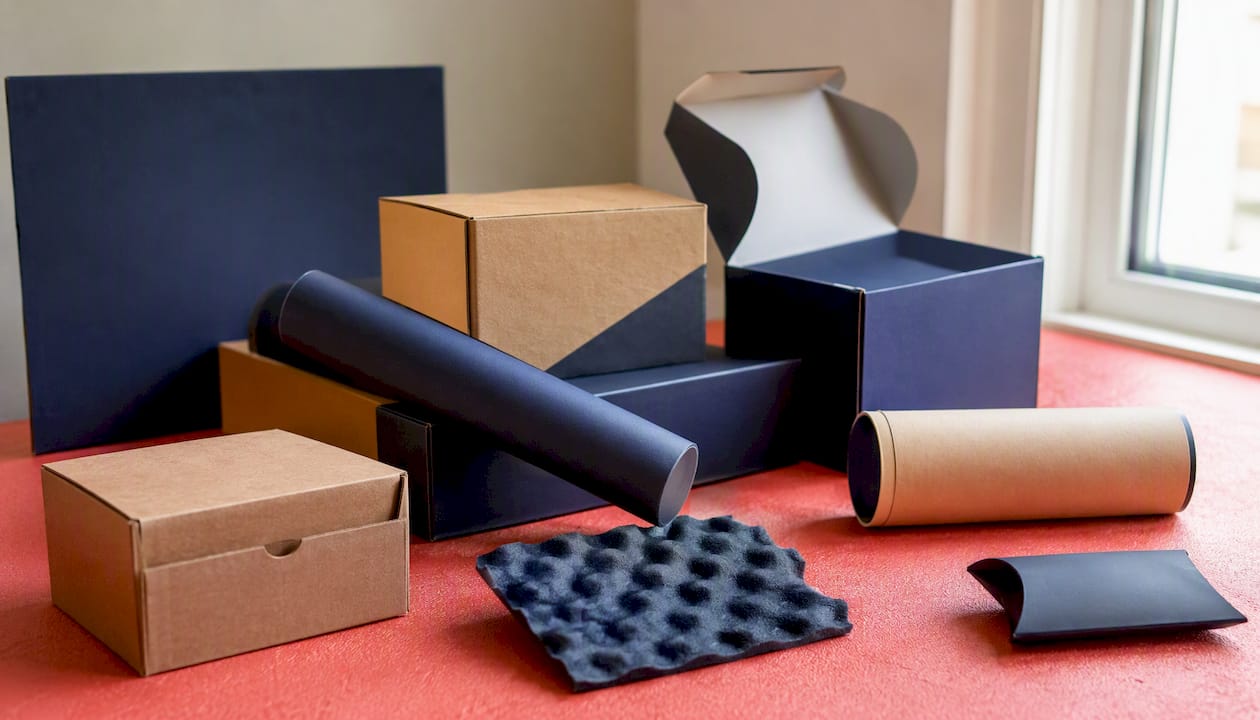
The format decision should follow the audience and the offer. A high-value B2B prospect justifies a dimensional piece. A reactivation campaign to a lapsed consumer list suits a polywrap with a time-limited offer.
List quality beats creative
Address verification, deduplication, and RFM segmentation (recency, frequency, monetary value) are the highest-return investments in direct mail. Undeliverable addresses waste print and postage; duplicate records annoy recipients and inflate costs. An RFM-scored list sent a relevant offer will outperform a broad list sent a beautifully designed piece.
| List hygiene action | Impact | Priority |
|---|---|---|
| Address verification (PAF lookup) | Reduces waste, improves delivery | High |
| Deduplication | Removes duplicates, cuts cost | High |
| RFM segmentation | Targets highest-value recipients | High |
| Suppression of recent opt-outs | Legal requirement, protects brand | Critical |
| Lapsed address removal (18+ months) | Improves response rate | Medium |
Trackable, consent-aware follow-up
Combine direct mail with a timed SMS or email follow-up 3–5 days after estimated delivery. Use holdout groups (a matched cohort that receives no follow-up) to measure the incremental lift from the digital touch. UTM parameters on PURLs and phone-level attribution via unique call tracking numbers give you clean, channel-level data.
Paid search, paid social and SMS tactics to boost response
Paid search
High-intent keyword clusters (transactional and comparison queries) convert at materially higher rates than broad awareness terms. Ad customisers that pull in dynamic elements (location, countdown, product name) improve relevance without requiring dozens of separate ad variants. Landing pages must match query intent precisely; a generic homepage as a destination wastes click budget.
Quick experiments to run:
- Split test a query-matched landing page against your current destination.
- Add negative keywords to exclude low-intent traffic.
- Test responsive search ad headlines that lead with the benefit, not the brand name.
Paid social
Creative fatigue is the primary response killer on paid social. Refreshing creative regularly maintains response rates as frequency builds. Lookalike audiences modelled from your highest-responding segments outperform broad demographic targeting. Exclusion lists (suppress recent converters, current customers, and recent non-responders) reduce wasted impressions and keep CPM efficient.
Behaviour-led customer journeys — welcome sequences, win-back flows, predictive re-engagement — improve response and retention across lifecycle stages when orchestrated across push, email, and paid social together.
SMS
SMS requires explicit opt-in consent under UK PECR rules. Keep messages under 160 characters where possible, lead with the offer, and include a single, one-tap CTA. Frequency above two messages per week risks opt-out spikes. For B2C campaigns, email marketing strategies for consumer brands provide useful sequencing patterns that translate well to SMS cadence planning.
Fix your data first: hygiene, segmentation and UK compliance
Audience selection drives roughly 40% of campaign response variance, making data quality the highest-return fix available. Before any creative work begins, run this 24–48 hour checklist:
- Email validation: remove invalid, role-based (info@, sales@), and catch-all addresses.
- Postal verification: run addresses through PAF (Postcode Address File) lookup.
- Deduplication: merge or suppress duplicate records across data sources.
- Enrichment: append missing fields (job title, company size, sector) from consented sources.
- Stale address removal: suppress email addresses with no engagement in 12–18 months.
- Suppression lists: apply opt-out, unsubscribe, and DNC (Do Not Contact) lists before every send.
Segmentation that works
RFM segmentation (recency, frequency, monetary value) is the practical starting point for most teams. Behavioural segmentation — based on pages visited, content downloaded, emails clicked — outperforms demographic models for response and downstream revenue. Propensity scoring directs budget to likely responders before spend is committed, compounding gains at scale.
UK compliance essentials
UK GDPR and PECR require a lawful basis for every use of personal data in marketing. For email and SMS to consumers, that basis is almost always explicit consent. For B2B email, legitimate interest may apply, but it requires a documented balancing test. Third-party data must come with evidence of the original consent and must be compatible with your stated purpose. Document your processing activities in a Record of Processing Activities (ROPA) and review it before each new campaign type.
The Network Advertising Initiative provides guidance on responsible targeting when using programmatic or third-party cookie-based audiences. When in doubt, consult the ICO’s direct marketing guidance directly.
How to design experiments that prove real uplift
Testing framework
Test one variable at a time. Changing subject line, send time, and body copy simultaneously makes it impossible to attribute the result. Set a minimum sample size before you start; a common pragmatic threshold is 200 contacts per variant for email, though larger samples give more reliable results. Use holdout groups to measure incremental lift: a matched cohort that receives no treatment is the cleanest way to prove a tactic works rather than coincides with a seasonal uplift.
- Define the single variable to test.
- Set the minimum sample size per variant.
- Assign contacts randomly to test and control groups.
- Run the test for a full send cycle (avoid stopping early when one variant leads).
- Measure the primary metric (reply rate, positive reply rate, or meeting booked rate).
- Record the result in a shared test log with sample size, dates, and outcome.
| Metric | What it measures | Reporting cadence |
|---|---|---|
| Reply rate | Overall response signal | Per send |
| Positive reply rate | Genuine interest signal | Per send |
| Meeting booked rate | Pipeline conversion | Weekly |
| CAC (cost per acquisition) | Efficiency of spend | Monthly |
| Revenue lift vs. holdout | Incremental value of tactic | Per campaign |
Statistical significance in practice: with small lists, aim for a directional signal over two or three test cycles before scaling. Common pitfalls include ending a test after the first promising result (underpowered), running multiple simultaneous changes, and comparing results across different send days or seasons.
Pro Tip: Store every test result in a shared log with the hypothesis, variable, sample size, result, and decision. This library becomes a compounding asset: new team members can skip experiments that have already been run, and patterns across tests reveal which variables move the needle most reliably for your specific audience.
For a deeper look at A/B testing methodology and governance, the Michaelbell blog covers practical frameworks for data-driven marketing teams.
Multi-touch follow-up sequences for B2B and B2C
B2B sequence (4–6 touches)
| Touch | Timing | Purpose | Ask |
|---|---|---|---|
| 1 | Day 1 | Signal-based opener | Soft: request a reply or reaction |
| 2 | Day 3–4 | New angle or value add | Share a relevant insight or resource |
| 3 | Day 7–8 | Social proof | Brief case study or outcome reference |
| 4 | Day 12–14 | Direct question | Ask a specific, easy-to-answer question |
| 5 | Day 18–20 | Channel switch | LinkedIn connection or phone call |
| 6 | Day 3–5 | Breakup message | Close the loop, leave the door open |

One ask per message. The breakup message (“I’ll stop reaching out — happy to reconnect if timing changes”) often generates replies from contacts who had been meaning to respond. For high-value deals, extend spacing between touches 4–6 and consider escalating to a phone call or LinkedIn voice note at touch 5.
B2C sequence (2–4 touches)
B2C sequences move faster and rely more on offer clarity and creative than on personalised narrative. For consumer email campaigns, CPG email marketing tactics offer useful sequencing patterns and creative hook ideas.
Switch channel when email response stalls: a direct mail piece, an SMS, or a retargeted paid social ad to the same segment can reactivate contacts who have gone quiet on email.
How MB Brand Communications approaches lifting response rates
When we work with a marketing team on response rate improvement, the process follows a consistent structure:
- Discovery and data audit: review current list quality, authentication setup, sequence design, and reporting gaps.
- Segment modelling: build or refine RFM and behavioural segments; identify suppression gaps.
- Creative test plan: define the variables to test, set sample sizes, and agree on success metrics before any send.
- In-flight optimisation: monitor deliverability, reply rates, and positive reply rates in real time; reallocate budget or pause underperforming variants quickly.
- Measurement and reporting: produce a clean results summary with holdout comparison and a recommended next test.
MB Brand Communications operates as an extension of your team, not an outside vendor parachuted in for a single campaign. We cover customer journey mapping and orchestration, direct mail production, email programme support, deliverability remediation, and creative testing across channels.
When hiring an agency to improve response rates, ask these questions: Do they audit your data before touching your creative? Can they show you a test log from a previous engagement? What is their SLA for deliverability remediation? How do they measure incremental lift rather than just overall response? An agency that cannot answer these clearly is optimising for activity, not outcomes.
Questions to ask any agency partner before signing:
- How do you handle data access and GDPR compliance during onboarding?
- What is your A/B test methodology and minimum sample size policy?
- How quickly can you remediate a deliverability issue?
- How do you report incremental lift versus baseline?
What we’d fix first
The first three things we change when brought in to improve response rates are almost always the same: authentication (SPF, DKIM, DMARC), list quality (validation and suppression), and sequence structure (adding follow-ups where there are none, or replacing “just checking in” touches with genuine value adds).
These three changes are operational, not creative. They do not require a new brief, a new brand look, or a new campaign concept. A focused pilot of four to six weeks, run on a clean segment with a structured sequence and proper authentication, typically produces a measurable improvement in reply rate before any creative work begins. That early signal is what justifies the broader investment.
MB Brand Communications: the agency that works like your team
Getting the data right, the sequences right, and the deliverability right before spending on creative is exactly what we do at Michaelbell. Our agency services cover the full stack: data audits, campaign testing, direct mail production, email deliverability support, and customer journey mapping, all delivered as a genuine extension of your marketing team rather than a separate supplier relationship.
The most practical next step is a quick audit: we review your current list quality, authentication setup, and sequence structure, and come back with a prioritised fix list and a pilot campaign proposal. No long procurement process, no retainer commitment to start. If you want to see what a focused four-to-six-week pilot looks like for your specific channels, get in touch via our customer journey page or browse the full range of campaign and communications services to find the right starting point.
Sources
The sources below underpin the benchmarks, frameworks, and tactics in this article. Each is worth bookmarking for the specific follow-up task noted.
- Cold email best practices
- Campaign response optimization
- How to Improve Your Cold Email Response Rate
- Email Optimization: 9 Best Practices That Actually Move Reply Rates (2026)
- Cold email reply rate: what is good and how to raise it